

In the digital age, where data-driven decisions are paramount, understanding the process of data analysis is more crucial than ever. Data analysis allows businesses to understand trends, predict future demands, and make informed decisions. Here’s a step-by-step guide to the data analysis process.
Table of Contents
Below is a tabular representation of the Data analysis process:
| Step | Importance | Description |
|---|---|---|
| 1. Defining the Objective | Identify the goal of the analysis. | Collaborate with stakeholders to determine what you’re trying to achieve. A clear question leads to clearer insights. |
| 2. Data Collection | Source relevant data for analysis. | Identify primary and secondary data sources. Use tools like web scrapers, surveys, or APIs. |
| 3. Data Cleaning | Ensure data accuracy and relevance. | Use tools like Python or R to cleanse the data: remove duplicates, fill missing values, correct discrepancies. |
| 4. Data Exploration | Understand preliminary data patterns. | Use statistical techniques and visualization tools to detect patterns, correlations, or outliers. |
| 5. Data Analysis | Extract deep insights from the data. | Use statistical models, machine learning algorithms, or analytics tools based on your objective. |
| 6. Interpretation and Reporting | Translate results into business insights. | Collaborate with business experts to understand findings. Use visualization tools for clearer representation. |
| 7. Taking Action | Implement data-driven decisions. | Recommend actionable strategies based on insights. Monitor outcomes to validate analysis and guide future steps. |
Here are the 5 data analysis processes.
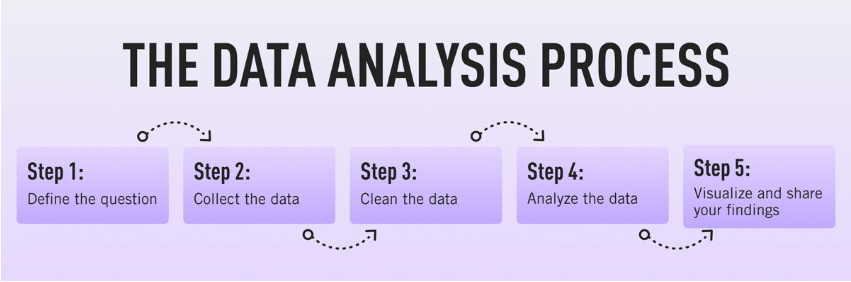
1. Defining the Objective
Why It Matters: Before diving into data, it’s imperative to identify the objective. What are you trying to achieve with your analysis? Do you want to understand a trend, predict a future event, or determine the root cause of a problem?
How To Do It: Collaborate with stakeholders to pinpoint key questions. Remember, a well-defined question is halfway to the answer.
2. Data Collection
Why It Matters: Data is the lifeblood of analysis. However, not all data is useful. The right kind of data must be sourced to answer your questions.
How To Do It: Identify primary (first-hand) and secondary (publicly available) data sources. To gather this data, utilize tools like web scrapers, surveys, or APIs.
Learn more: What’s The Difference Between A Data Scientist And A Data Analyst?
3. Data Cleaning
Why It Matters: Raw data is often messy. It can contain duplicates, errors, or irrelevant information, which can skew results.
How To Do It: Use software tools or languages like Python or R to cleanse your data. This process includes removing duplicates, filling missing values, and correcting discrepancies.
4. Data Exploration
Why It Matters: Before diving into deep analysis, it’s beneficial to get a ‘feel’ for your data. What patterns are immediately noticeable? Are there any anomalies?
How To Do It: Use statistical techniques and visualization tools to plot your data. This can help identify patterns, correlations, or outliers that merit deeper investigation.
5. Data Analysis
Why It Matters: This is the heart of the process. Here, you dive deep to draw insights from your data using various analytical models and techniques.
How To Do It: Depending on your objective, employ statistical models, machine learning algorithms, or other data analytics tools to interrogate your data.
6. Interpretation and Reporting
Why It Matters: Raw results from data analysis are often complex. They need to be interpreted in the business context to draw actionable insights.
How To Do It: Collaborate with business experts to understand the implications of your findings. Use visualization tools to represent these findings in an easily digestible manner.
7. Taking Action
Why It Matters: Data analysis isn’t just an academic exercise. Its end goal is to inform business decisions.
How To Do It: Based on the insights drawn, recommend actionable strategies. Monitor the outcomes of these actions to validate the analysis and refine future efforts.
Learn more: The Best Online Data Analytics Courses for 2023
Conclusion:
Data analysis, much like what one would experience in a Data Analyst Internship, is systematic and methodical, ensuring that raw data is transformed into actionable insights. While the above guide provides a step-by-step overview, adapting and refining the process based on specific needs and contexts is crucial. The ultimate goal is to derive value from data, driving informed decisions and strategies.
FAQ’s
1. What software tools are commonly used in data analysis?
Answer: Tools such as Excel, R, Python, SAS, and SQL are popular in data analysis.
2. How long does the data analysis process take?
Answer: The duration varies based on the objective, data size, and complexity of the analysis.
3. Is domain knowledge essential for data analysis?
Answer: While core analytical skills are paramount, domain knowledge provides context, making the analysis more relevant and actionable.
4. How do I ensure the reliability of my analysis?
Answer: Use clean, well-sourced data, apply appropriate statistical techniques, and continuously verify your results against the original objectives or questions.
5. How can I learn more about the data analysis process?
Answer: Numerous online courses, workshops, and resources are available for individuals interested in data analysis. Platforms like Coursera, Udemy, and Khan Academy offer beginner to advanced-level courses.