

In the vast landscape of research and data analytics, the line between quantitative and qualitative data plays a pivotal role. The delineation doesn’t just end at their textbook definitions but spills over to their collection methods, nature, and subsequent analysis. This guide aims to highlight the core differences between these two data categories, highlight top countries’ salary benchmarks for professionals, and guide you on accessing free data analytics courses.
Table of Contents
Defining Quantitative vs Qualitative Data
Quantitative data, by nature, is numerical and objective. It revolves around quantities and measurable parameters. Parameters like the frequency of your online shopping sprees in the past month or the growth trajectory of a specific sector.
Conversely, qualitative data is descriptive and carries a tinge of subjectivity. It encapsulates characteristics and descriptors that can’t be readily measured, such as subjective feelings, perceptions, or deeply held beliefs—for instance, the rationale behind preferring one brand over its competitor or the feedback loop post-product utilization.

Multivariate Analysis in Quantitative Data
Multivariate Analysis stands tall as an advanced offshoot of quantitative data analysis. It simultaneously scrutinizes more than two variables. Its utility is most palpable when discerning trends and patterns within extensive datasets.
Table comparing the critical differences between Quantitative vs Qualitative Data:
| Aspect | Quantitative Data | Qualitative Data |
|---|---|---|
| Nature | Numerical | Descriptive |
| Purpose | To quantify problems by generating numerical data or data transformable to statistical information | To gain an understanding of underlying reasons and motivations |
| Data Collection | Surveys, structured observations, experiments | Interviews, open-ended questions, observations |
| Analysis | Statistical methods, including regression and factor analysis | Thematic analysis, coding, narrative analysis |
| Outcome | Generalizable results, often represented in tables and graphs | Detailed insights, often represented in words or visuals |
| Examples | Age, weight, test scores | Opinions, emotions, perceptions |
| Primary Questions | How many? How often? How much? | Why? How? |
| Research Type | Inductive seeks to build theories | Typically, in numbers, charts, graphs |
| Presentation of Results | Typically, in words, images, or as themes | Typically, in words, images, or themes |
This table briefly summarises the fundamental distinctions between the two data types. Understanding these differences is essential when embarking on any research or data analysis project.
Collection and Analysis Methods
The genesis of quantitative data is typically rooted in structured methodologies like comprehensive surveys and targeted experiments. Statistical techniques, including regression analysis, factor analysis, and the quintessential Multivariate Analysis, are employed to dissect this data.
On the flip side, qualitative data sees the light of day from more pliable avenues like exhaustive interviews or focus group discussions. Insights in the form of themes, discernable patterns, and overarching concepts are often extracted from this kind of data.
Salary Comparison by Country and Qualification
| Country | Entry-Level Salary | Mid-Level Salary | Advanced-Level Salary |
|---|---|---|---|
| USA | $50,000 | $75,000 | $120,000 |
| UK | £40,000 | £55,000 | £80,000 |
| Australia | AUD 65,000 | AUD 85,000 | AUD 130,000 |
| Canada | CAD 60,000 | CAD 80,000 | CAD 115,000 |
Note: It’s essential to remember that salary benchmarks can oscillate based on geographical nuances, the stature of the company, and other dynamic variables. The numbers quoted above serve as rough annual estimates.
Qualifications and Learning Trajectory
The realm of data analytics frequently demands a robust foundation in both statistics and programming. For someone looking to tread this path:
- Bachelor’s degree in Statistics, Computer Science, or other allied fields.
- Proficiency in programming languages, most notably Python or R.
- Acquaintance with data visualization tools such as Tableau or Power BI.
To elevate your academic pursuits, there are a plethora of online platforms offering free data analytics courses. Platforms such as Coursera and edX curate courses from global universities’ crème de la crème. (Do verify course-specific certification fees, if any.)
For deeper insights into Quantitative Risk Management in Python and a more nuanced perspective, this article on DataCamp offers an exhaustive exploration.
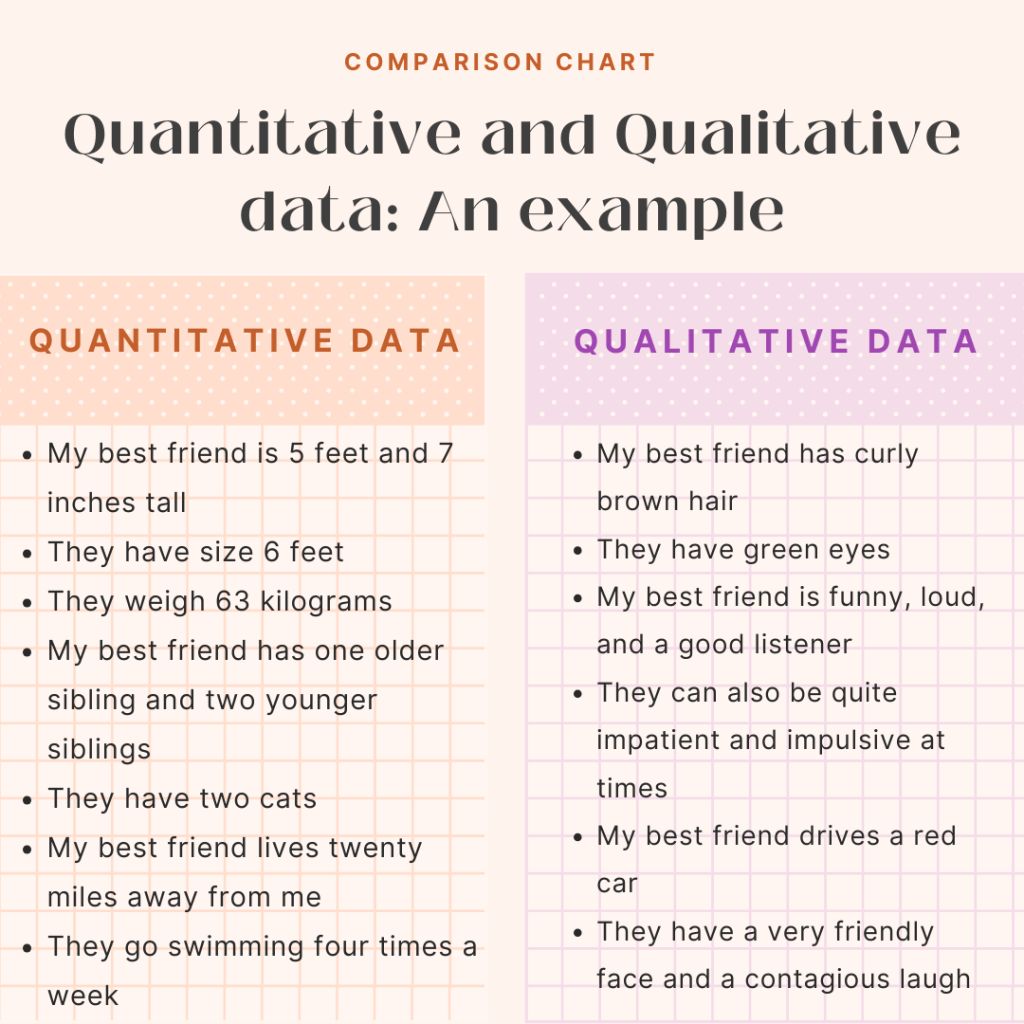
The difference between quantitative and qualitative data: An example
Closing Musings
Whether making your maiden voyage into research, upskilling in data analytics, or quenching an insatiable intellectual thirst, understanding quantitative and qualitative data remains the cornerstone. With the digital realm replete with free data analytics courses and the exponential rise of data-centric decision matrices in global enterprises, the field beckons with open arms.
FAQs on Quantitative vs Qualitative Data
1. What is an example of quantitative and qualitative data? Quantitative data is numerical and can be measured. For example, the number of students in a class, or the height of a building in meters. On the other hand, qualitative data is descriptive and is not based on numbers. An example of qualitative data would be describing the color of the sky as ‘blue’ or the feeling of a movie as ‘sad’ or ‘inspiring’.
2. What are 3 examples of qualitative data?
Three examples of qualitative data include:
a) The aroma of a coffee being described as ‘rich’ and ‘earthy’.
b) A book review stating the plot was ‘intriguing’ and the characters ‘complex’.
c) An interview transcript where someone recalls their childhood memories.
3. What is quantitative data examples? Quantitative data are data points that can be measured and counted. Examples include:
- The age of an individual (e.g., 25 years old).
- The number of students attending a seminar (e.g., 150 students).
- The temperature of a city (e.g., 22°C).
4. What is the difference between qualitative and quantitative data Quora? On platforms like Quora, users often define qualitative data as descriptive data that revolves around attributes and characteristics that can’t be counted, such as feelings or perceptions. Quantitative data, in contrast, can be counted or measured, providing information in numerical form, such as statistics or percentages.
5. What is the difference between qualitative and quantitative methods? Qualitative methods collect data that provides depth and insight into the subject, often using interviews, focus groups, or textual analysis. The data collected is non-numerical and is used to understand concepts, thoughts, or experiences. Quantitative methods, on the other hand, involve collecting numerical data that can be converted into usable statistics. These methods aim to quantify the data and apply some form of statistical analysis to understand and interpret the data.